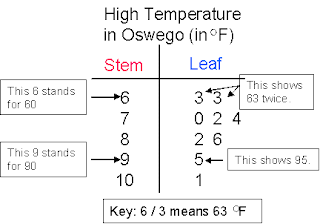
This is a stem an leaf plot because it uses one side of the chart to represent the 10's place and the other side to represent the ones place that correspond to each 10's digit in a group of recorded numbers. In this case the data recorded were the high temperatures of the Oswego.

No comments:
Post a Comment